On Covid-19 Expansion
PSE carried out an analysis comparing the Covid-19 contamination rate, in each municipality, with the real mobility of populations. Mobility is measured through the APP PSE Mobility Panel, which, through a panel, manages to know the actual displacement of the population, at each hour of the day. This study has been conducted 24 hours a day, every day of the year, since 2019.
If isolation is the great weapon against the expansion of Covid-19, it is important to know whether the change in mobility behaviour of the Portuguese has produced effects.
In the different Portuguese counties, there are different realities of mobility in normal periods. There are counties where residents have a clear need for intercity travel, others are large centralities that receive residents from other counties daily, and there are still mixed situations.
With this PSE study on real mobility, it is possible to determine which counties are being more, and less compliant, with the recommendation of voluntary isolation, and to understand whether changes in mobility behaviours before and after isolation guidelines have had an impact on progression of Covid-19.
CONFINEMENT AND CASE GROWTH
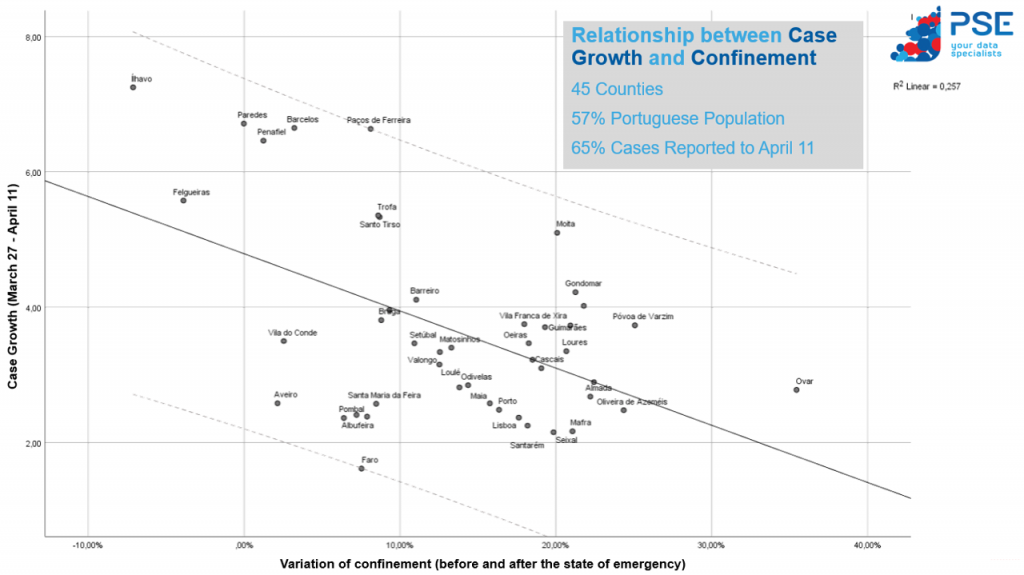
Based on the DGS report of 11 april and the growth of cases since 27 march, in this analysis we see the relationship between increased confinement and the rate of growth of cases.
In this analysis of 45 counties that represent 57% of the Portuguese population and 65% of the cases reported on 11 april we see that the counties that tend to have the greatest behaviour change in terms of confinement tend to have, on average, lower growths of cases in this period.
Source: PSE, Mobility Panel, Information from 1 January to 11 April 2020.
For the quantification of contamination cases, the COVID-19 Report, from DGS, of April 11, 2020, was used.
Although the rate of contamination also depends on other factors, we can still see the correlation between the rate of confinement and the growth of cases.
CIRCULATION AND GROWTH OF CASES
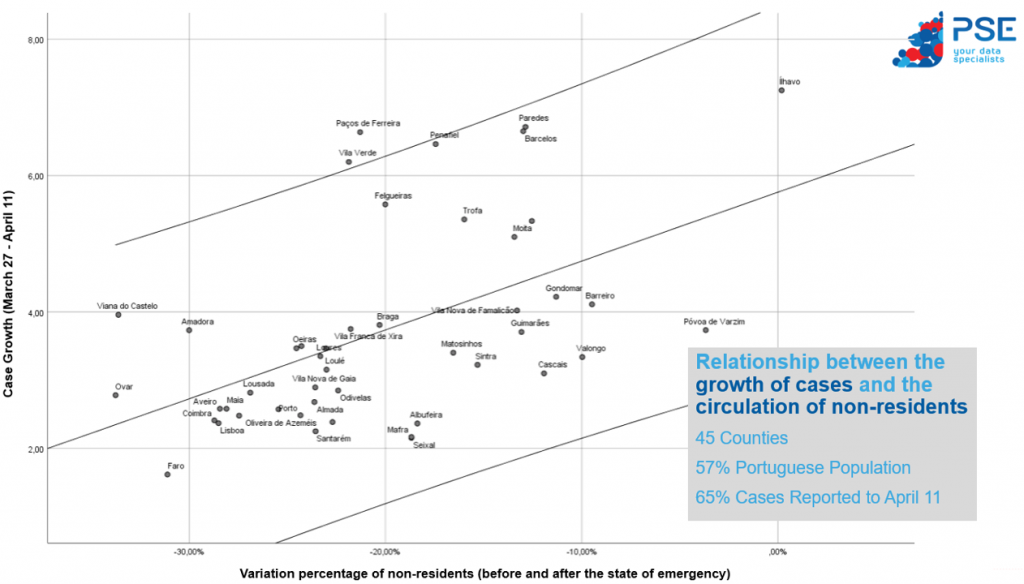
Similarly, in addition to the behaviour of residents in these 45 counties, we can see the changes before and after the isolation of the movement of non-residents.
In this case, the smaller the reduction in the circulation of non-residents, the smaller the tendency to increase cases.
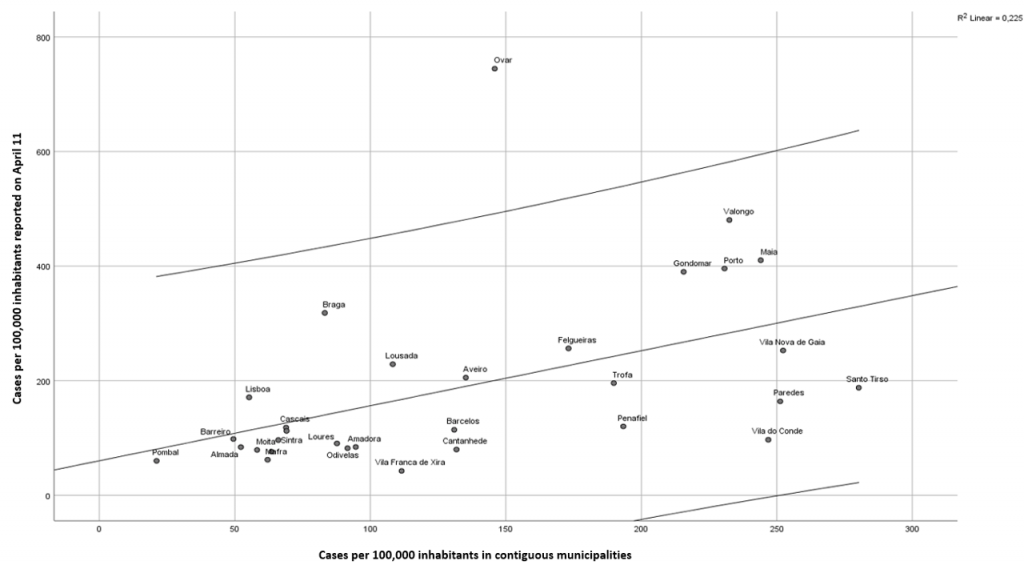
GEOGRAPHICAL CONTIGUITY AND CASES PER 100,000 INHABITANTS
If we analyze the relationship between the number of cases per 100,000 inhabitants and the number of cases per 100,000 inhabitants in the contiguous counties, we see that counties that have neighboring counties with a higher number of cases per 100,000 inhabitants also have more cases.
We also see that Ovar is a county that falls outside the average of this relation of Cases and Population, having justified the timely imposition of a sanitary fence on the county as a preventive measure of additional contagions, given the relationship between the penetration of Covid- 19 in population and geographic contiguity.
COVID-19 RISK RATIO BY MOBILITY
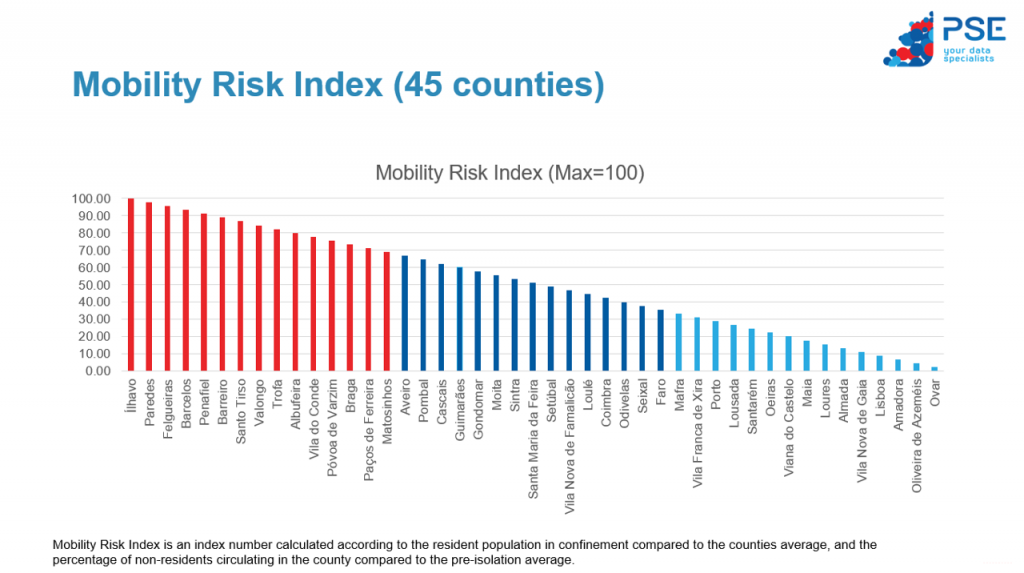
Combining the behavioral changes of the residents of the coutnies, and the movement of non-residents, we can see in a risk index that the different counties present different risks of progression of Covid-19. We can see in the graph, considering the 45 counties covered in this study, which represent 57% of the population and where 65% of the Covid-19 cases reported on 11 april are located, that the counties with the greatest change in behaviour are those with the lowest risk for mobility feature.
PSE CONTACT:
info@pse.pt
TECHNICAL NOTE: This study is the PSE panel, with continuous data collection through location monitoring and means of travel via mobile application of a panel of representative individuals from the Universe over 15 years old, residing in the regions of Greater Porto, Grande Lisbon, North Coast, Central Coast and Faro District. This study implies an APP installed on the mobile phones of the participating sample. So, we monitor the actual displacement of the population, at each hour of the day. This study is carried out 24 hours a day. The data are obtained rigorously, via GPS and with the consent of the monitored sample. For a universe of 6,996,113 individuals residing in the studied regions, the margin of error attributable to the study is 1.62% for a 95% confidence interval.

