Portuguese Mobility is Increasing and Half the Normal is Already. Confinement Level With Average Fall off -13%.
PSE studies the mobility of the Portuguese, continuously. This study is a panel that implies an APP installed on the mobile phones of the participating sample. Thus, we monitor the actual displacement of the population, at each hour of the day. This study is carried out 24 hours a day, since 2019. The data are obtained rigorously, via GPS and with the consent of the monitored sample, which is representative of the universe under study. Technical note at the end.
Firstly, it must be said that the behaviour of the population in relation to confinement at home is very different on working days (where it is less) than it is during the weekend (where it is greater). There is a drop – although not sharp – in the level of confinement, visible on the last Thursday, Friday, Saturday, Sunday, Monday and Wednesday, comparing the values of the previous year, we conclude that there has been an average drop of -13%.
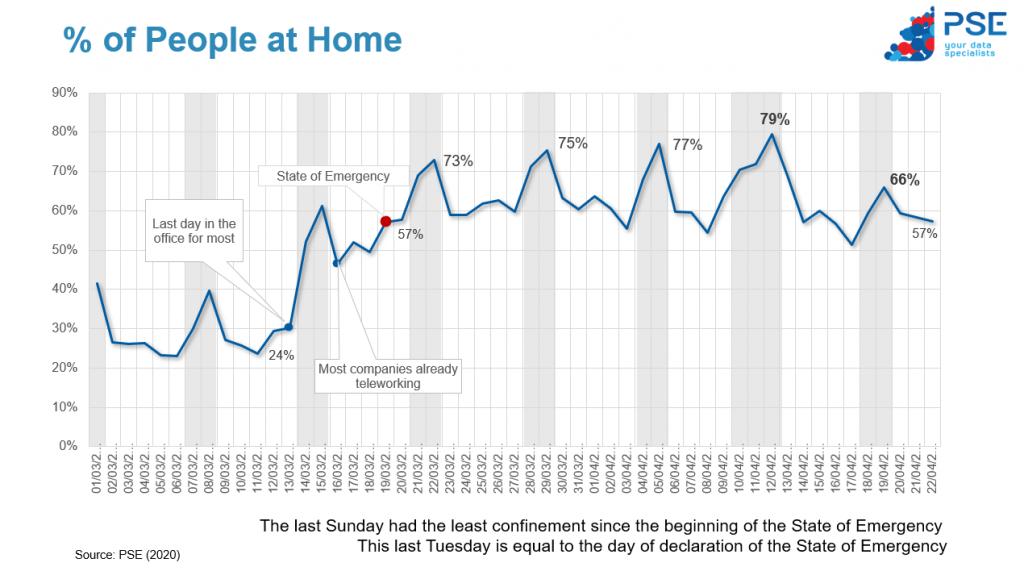
As this is an analysis already 7 days ago, we can conclude that there is a drop in confinement but at a moderate pace, with an average value of only -13% for this 7-day period, compared to the previous 7 days last year. That is, comparing Monday, with Monday and Saturday with Saturday.
We were yesterday with 57% of the Portuguese Confined at Home, a figure that is the same as that verified on the day of the declaration of the state of emergency. And the lowest recorded during this period in which we are in a state of emergency.
INCREASING MOBILITY OF PORTUGUESE
Analyzing PSE Mobility Index of the Portuguese population aged 15 and over, covered by the study, we can see the following graph. It is based on a base-100 index where 100 represents the normal mobility verified from 1 January to 13 March 2020.
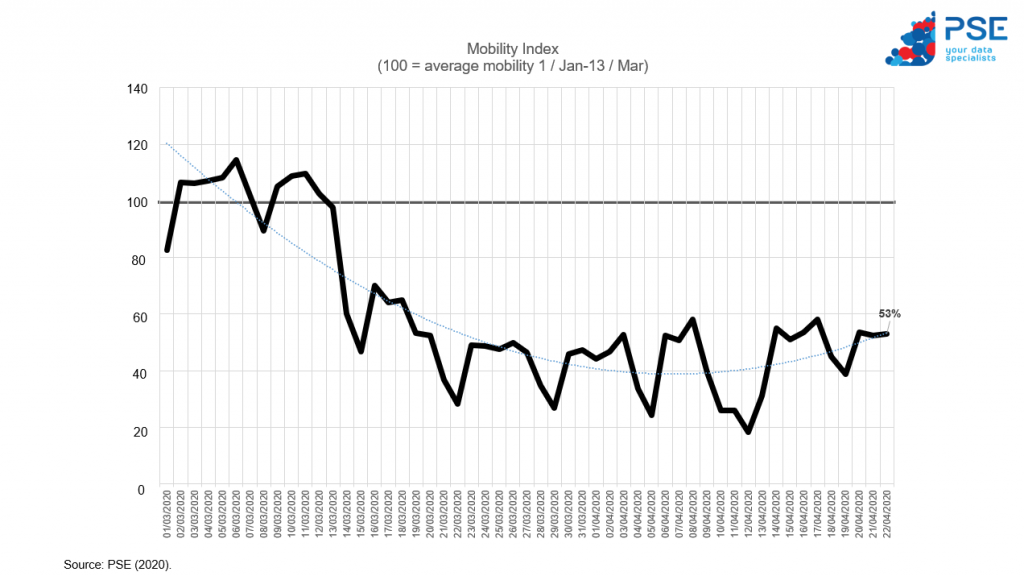
So, we can conclude that there is a slight, but clear, tendency for the Portuguese to increase their mobility, as shown by the blue trend curve.
However, it is also visible that we are very distant (47 points) from “normality”, that is, from the Index 100. We are now half as normal, but that was already 40% of the normal index, used as a reference.
It is important to follow this trend in the coming days, to understand whether or not it means a clear return to the street. This will possibly be clearer next week.
MOBILITY LEVELS
In addition to “Confinement at Home” we can also analyse the different levels of mobility. We present the following graph, where we indicate those who had “Low Mobility” (up to 10km per day), in “Medium Mobility” (from 10 to 20km / day) and also with “High Mobility” (more than 20km / day).
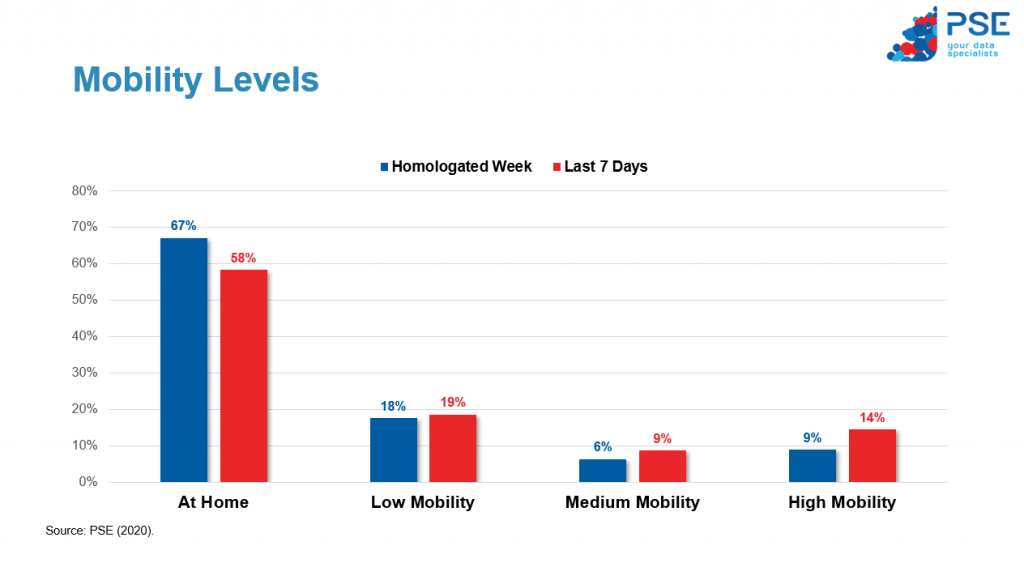
In this graph we can see in the last 7 days, in addition to the reduction in Confinement at Home, an increase particularly of medium and high mobility.
It is also important to highlight that the “natural” level of Confinement at Home, in which about 25% of the Portuguese stayed at home, verified in the first working days of March, more than doubled, being 57% on the last analysed day, 22 April 2020.
PSE CONTACT:
info@pse.pt
NOTE: This study produces since 2019, data that are applied, above all, in gauging the audience of outdoor advertising. And, to assist city councils in spatial planning and mobility and transport management, and also in behavioural studies of mobility and shopper, for other companies and entities.
TECHNICAL NOTE: This study is the PSE panel, with continuous data collection through location monitoring and means of travel via mobile application of a panel of representative individuals from the Universe over 15 years old, residing in the regions of Greater Porto, Grande Lisbon, North Coast, Central Coast and Faro District. This study implies an APP installed on the mobile phones of the participating sample. Thus we monitor the actual displacement of the population, at each hour of the day. This study is carried out 24 hours a day. The data are obtained rigorously, via GPS and with the consent of the monitored sample. For a universe of 6,996,113 individuals residing in the studied regions, the margin of error attributable to the study is 1.62% for a 95% confidence interval.

