CONFINMENT HAS REACHED 76%, BUT IT’S ALREADY FALLING.
PSE made an analysis crossing the covid-19 contamination rate, in each municipality, with the real mobility of the populations. Mobility is measured through the APP PSE Mobility Panel, which, through a panel, manages to know the actual displacement of the population, at each hour of the day. This study has been conducted 24 hours a day, every day of the year, since 2019.
The general confinement of the population peaked at 75% and 76% in two weekends. Now it is already falling and has evolved as follows:
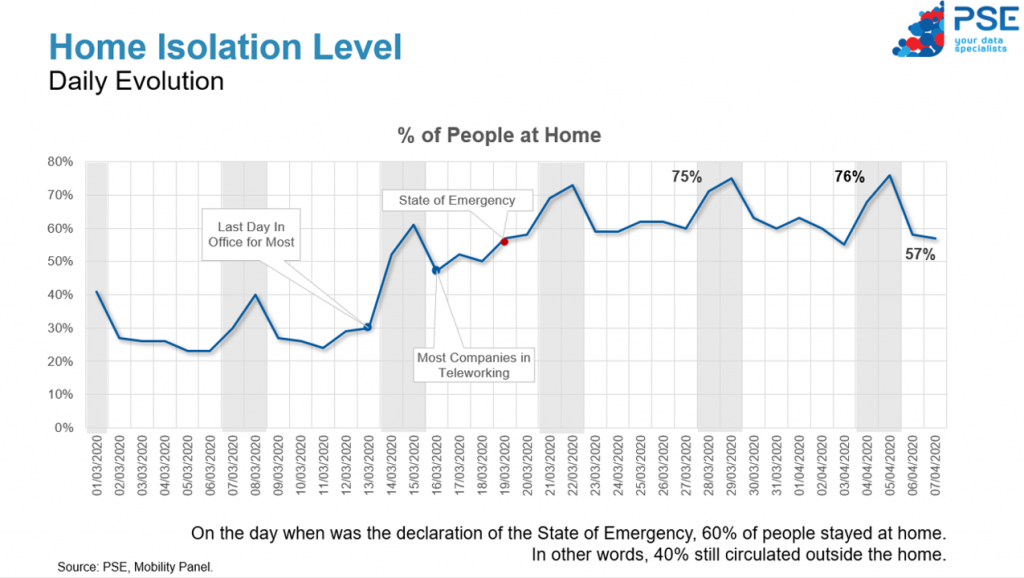
As we can see in the last week, there are already signs of reduced isolation, denoting a relaxation of the confinement that we will prove better during this week. The “State of Emergency” communication improved the levels of voluntary quarantine that the majority of the population was already complying with. The week of March 22 to 28 was where the greatest confinement took place. But the effect has been reduced since March 30.
In this other PSE analysis, it is proved that the greater isolation has, in practice, an evident and beneficial effect on the rate of contamination of the disease. Although the contamination rate has to do with many other factors, such as demographic density, or the level of contact with populations in other municipalities, we can still see the evident correlation between the mobility of the population of a municipality and the contamination rate of that municipality, in the following graphic:
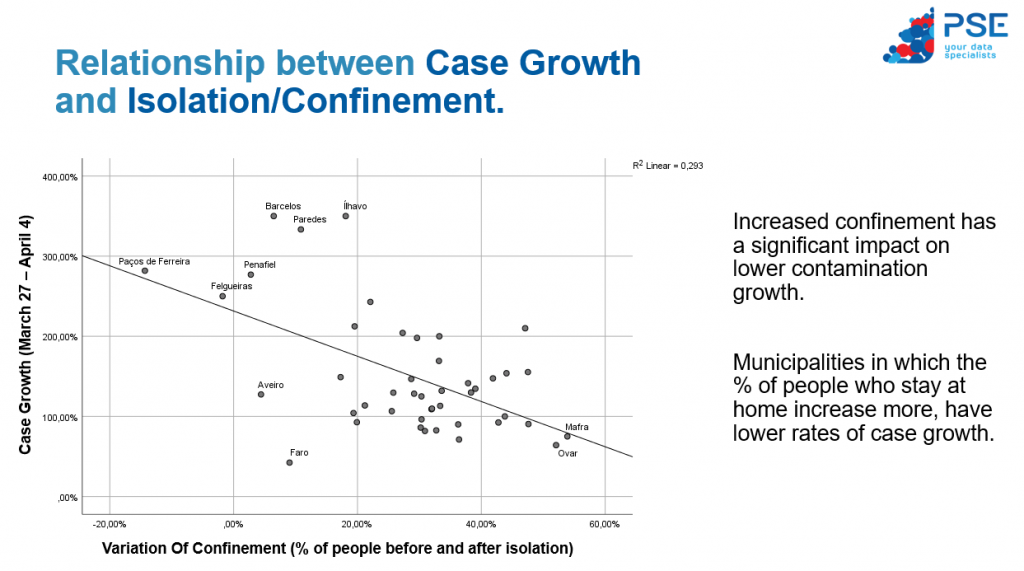
With this PSE study on real mobility, it is possible to determine which municipalities are being more, and less compliant, with the recommendation of voluntary isolation.
In other words, the COUNCILS with the highest COVID-19 risk and where, if there are no other factors, higher contamination growth rates are as follows:
TOP 10 COUNCILS WITH GREATER RISK COVID-19, DUE TO GREATER MOBILITY:
- Ílhavo
- Paredes
- Felgueiras
- Barcelos
- Penafiel
- Paços de Ferreira
- Guimaraes
- Gondomar
- Santo Tirso
- Trofa
Here you can see the graph, considering the 45 municipalities covered by the study at this stage, which represent 57% of the population and where 90% of Covid-19 cases are located:
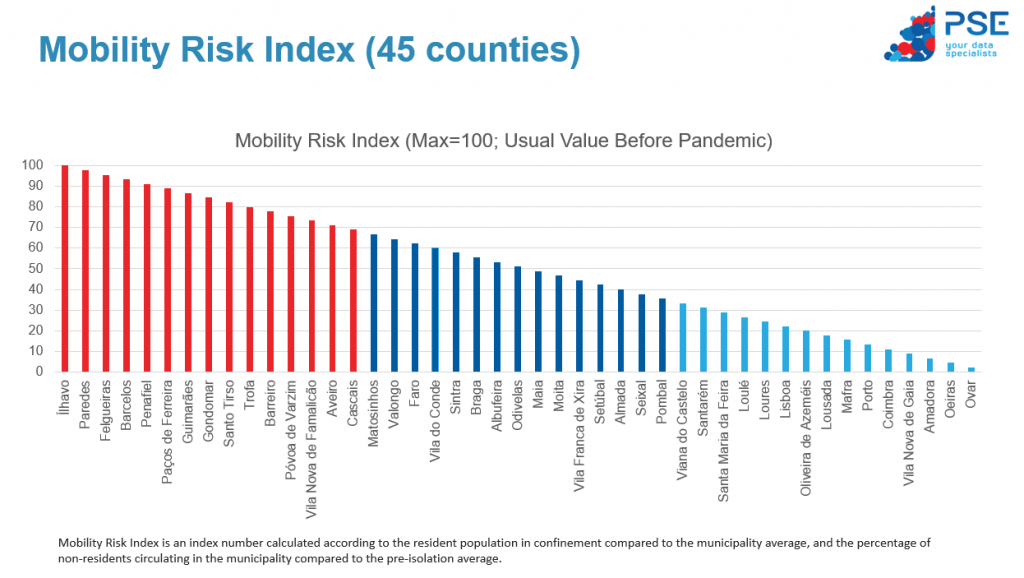
Source: PSE, Mobility Panel, Information from March 5 to April 6, 2020.
For the quantification of contamination cases they used the COVID-19 Report, from DGS, of April 5, 2020.
PSE CONTACT:
info@pse.pt
TECHNICAL NOTE: This study is the PSE mobility panel, with continuous data collection through location monitoring and means of travel via mobile application of a panel of representative individuals from the Universe over 15 years old, residing in the Greater Porto regions , Greater Lisbon, North Coast, Central Coast and Faro District. For a universe of 6,996,113 individuals residing in the studied regions (81% of the population aged 15 and over in Mainland Portugal), the margin of error attributable to the study is 1.62% for a 95% confidence interval.

